What types of POS displays are used in supermarkets?
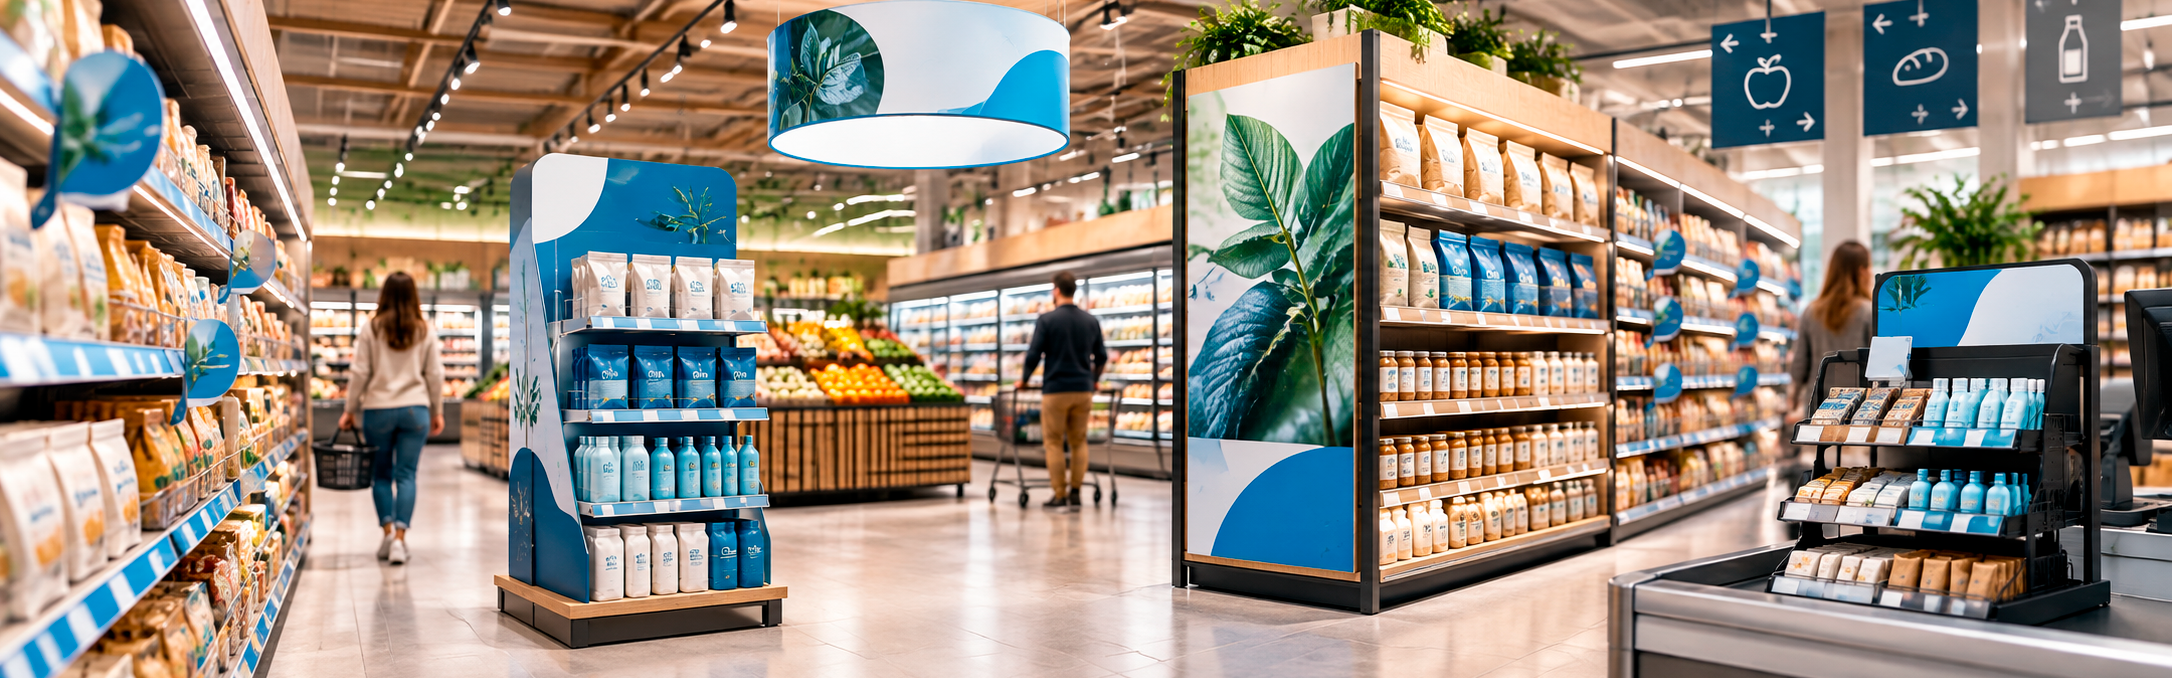
Supermarket POS materials can be grouped into six families: floor-standing displays, gondola ends, shelf materials, hanging elements, area signage and checkout displays. Each one corresponds to a different point in the shopper journey and has a very different physical durability threshold, ranging from two weeks to six months.
That is the short answer. The longer one starts with understanding where they are going to be installed.
Spain has 26,068 supermarkets, self-service stores and hypermarkets, according to the 5th Proximity Food Retail Distribution Report prepared by Retail Data for ASEDAS.
Twenty-six thousand different floor plans, twenty-six thousand sets of internal rules and twenty-six thousand department managers deciding which materials stay on the shop floor and which end up in storage.
That is why format selection should never start with the supplier’s catalogue. It should start with three questions: where will it be placed, how many weeks does it need to last, and who will install it? The rest of the article explores each of these questions.
The statistic the whole industry keeps misquoting comes from a 2012 US study
There is a figure that appears in virtually every article about POS: that between 70% and 82% of purchase decisions are made in-store. I have seen it quoted as 65%, 70%, 76%, 82% and 86%, sometimes on the same website.
It is worth knowing where it comes from. Its source is POPAI’s Shopper Engagement Study —now Shop! Association—, a US study whose most frequently cited edition dates from 2012, with a later update in 2014. In other words, it is data more than a decade old, measured in US supermarkets and applied without qualification to Spanish retail in 2026.
I am not saying it is false. I am saying that a trade marketer defending a €200,000 budget to a finance director needs something better than a 2012 figure circulating in five different versions.
That is where Spanish data comes in: it exists, and it is better.
What the real Spanish data tells us
The OSA Barometer, led by AECOC in collaboration with NIQ, measures on-shelf product availability in Spain. In the first half of 2024, the OSA rate stood at 96%: out of every 100 occasions on which a shopper looked for a product, they found it 96 times.
That remaining 4% is where the lost revenue sits.
There is also a second figure from the same barometer that hardly anyone uses and which I find the most revealing of all: out-of-stock recovery speed.
Spanish grocery retail resolves an out-of-stock 37% faster than French retail and 59% faster than US retail. It is an exceptionally agile supply chain.
And what does this have to do with POS? Everything. It means the pace of Spanish retail is
faster than the graphic material being sent into it. If the shelf is replenished in 2.7 days and your display takes three weeks to replace when it breaks, the mismatch is not logistical: it is the supplier.
| Country | Average days to recover from an out-of-stock |
|---|---|
| Spain | 2.7 |
| Great Britain | 3.7 |
| France | 4.1 |
| United States | 4.3 |
The six POS families: floor-standing displays, gondola ends, shelf materials, hanging elements, signage and checkout displays
I am going to order them according to the shopper’s physical journey through the store, rather than by product category. That is how decisions are made in practice.
1. Floor-standing displays (floor stands)
Freestanding cardboard, PVC or mixed-material structures positioned in central aisles or high-traffic areas. They offer the largest surface area for visual impact and are also the format most frequently removed ahead of schedule.
When they make sense: launches, high-turnover seasonal campaigns and products that require visual explanation.
Where they fail: convenience stores. There is a structural change here that much of the industry has still not fully incorporated. According to ASEDAS, more than half of Spanish food retail stores (50.6%) are now convenience or proximity formats. A floor-standing display designed for a 3,000 m² hypermarket is simply unworkable in a 400 m² urban supermarket where every metre of aisle space is contested.
Durability threshold: an unreinforced micro-flute cardboard display performs well for 3–4 weeks in a medium-traffic area. At an aisle end where it is repeatedly hit by trolleys, its real lifespan is cut roughly in half. (Range based on Artyplan’s production and rollout experience; it does not come from a published industry study.)
2. Gondola ends (endcaps)
The most expensive space in the store and the most hotly contested in annual negotiations with the retailer. Graphic material here is not decorative: it is what demonstrates to the department manager that the space is being used effectively.
Critical requirement: exact dimensions. Every retailer has its own gondola-end standard, and they do not match. A front panel designed for one retail chain’s gondola end will not fit another’s, resulting in material being installed crooked or not installed at all.
This is where more projects go wrong than anywhere else. Not because of print quality, but because the actual plans for each retailer were not checked before production.
3. Shelf materials
Stoppers, shelf strips, trays, dividers and shelf-edge strips. Small pieces, large print runs and high variation in dimensions.
It is the least glamorous format and the one that creates the most logistical problems, because a stopper campaign for 1,200 stores means preparing 1,200 different kits according to each store’s assortment. The challenge here is not printing. It is picking.
4. Hanging elements
Mobiles, hanging banners and overhead displays offer high visibility from a distance, but their POS and graphic material installation costs are higher.
The detail almost nobody asks about before production: many retail chains prohibit hanging elements under their internal health and safety rules, or require them to be installed by their own specially trained staff. Producing 800 mobiles only to discover afterwards that the retailer does not allow them to be hung is an expensive and surprisingly common mistake.
5. Low-traffic area signage and environmental graphics
Floor vinyl, wall graphics and section branding. They transform low-turnover areas and can remain in place for long campaigns.
Floor vinyl is a special case. It requires slip-resistance certification and an adhesive compatible with the flooring. A poorly selected vinyl can start peeling after three days, and the problem is not the printing: it is the laminate.
6. Checkout displays
Pure impulse-purchase territory. Very limited space, maximum competition and weekly turnover.
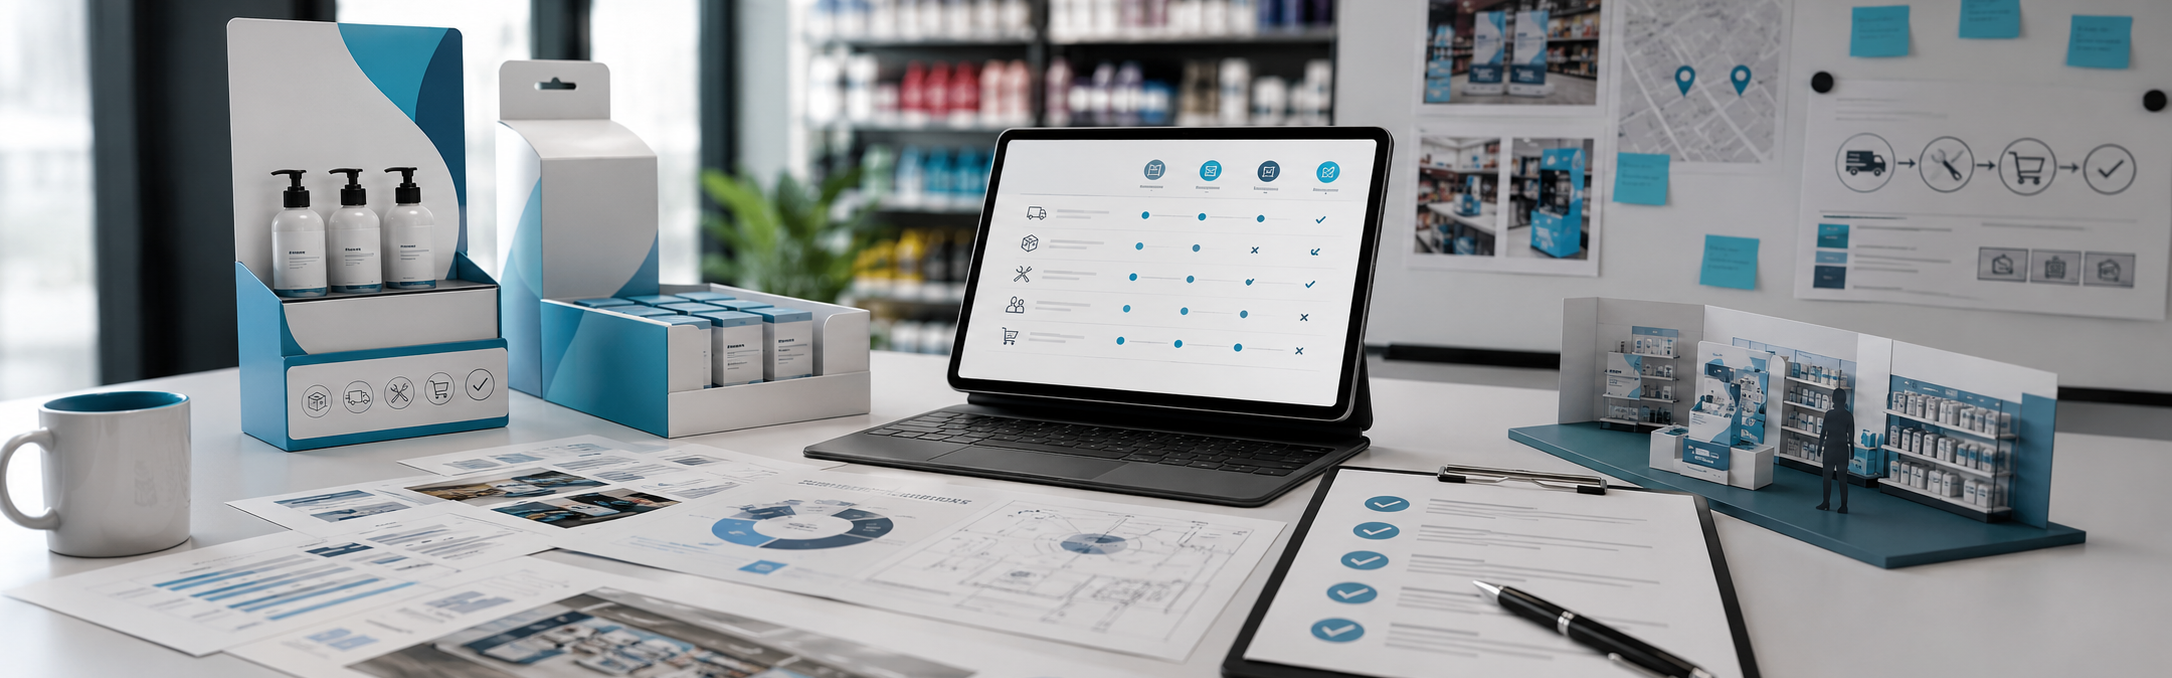
Decision table: which format for which objective
| Format | Store area | Realistic lifespan | Relative cost | Installation | Best for |
|---|---|---|---|---|---|
| Floor-standing display | Central aisle, entrance | 3-4 weeks | High | Requires assembly | Launches, seasonal campaigns |
| Gondola end | End of aisle | 4-8 weeks | Medium-high | Simple if dimensions are exact | Promotions negotiated with the retailer |
| Shelf material | Shelving | 6-12 weeks | Low per unit | Simple, high volume | Sustained visibility, brand blocking |
| Hanging display | Overhead | 4-6 weeks | Medium | Complex, subject to permission | Visibility, directing traffic |
| Area signage | Floor, wall, section | 3-6 months | Medium | Specialist | Environmental graphics, low-turnover categories |
| Checkout display | Checkout area | 2-4 weeks | Low-medium | Simple | Impulse purchases, small products |
The most expensive mistake: budgeting units instead of configurations
I am going to state an opinion that not everyone in my industry likes: most POS campaigns
that fail do not fail because of design or print quality. They fail because the stores were not
counted properly.
Let me explain with numbers. A campaign for a retail chain with 900 points of sale does not mean 900 identical units. Typically, it means:
- 900 units of base material
- Between 8% and 12% replacement stock for breakages and incidents
- 3 or 4 size variants depending on store format
- A percentage of stores where the main format does not fit and needs to be replaced with an alternative
A 900-store campaign needs a budget for around 1,050 units spread across 3–4 configurations. (Artyplan internal working ratio based on multi-site campaigns.)
When someone requests a quote for “900 displays”, the real project is closer to 1,050 units spread across four different configurations, with a store-specific picking kit for each location. If the supplier quotes 900 identical units, they are not quoting the campaign. They are quoting part of it.
And that mismatch does not show up during purchasing. It appears during rollout week, when 60 stores are missing pieces and there is no replacement stock.
Retail floor space grew twice as fast as the population: why this changes POS design
There is an underlying trend forcing POS design to be reconsidered, and ASEDAS data shows it clearly.
Between 2020 and 2025, Spanish food retail floor space grew by 8.9%. Spain’s population grew by 3.8% over the same period. Retail floor space therefore grew at more than twice the rate of the population.
That growth has not come from new hypermarkets. It has come from convenience stores: smaller urban formats with less free aisle space and less tolerance for promotional material taking up room.
Growth 2020–2025: retail floor space vs population
ASEDAS / Retail Data, 5th Proximity Food Retail Distribution Report
More than twice as fast
The store estate is growing and becoming fragmented into increasingly smaller formats.
The practical consequence: the store estate that campaigns need to serve grows every year, fragments into more formats and leaves less available space per store. Designing a campaign around the hypermarket as the reference format and then adapting it “downwards” is working backwards.
Five questions before approving the final artwork
Do I have the actual dimensions for each retail chain, verified this year? Gondola-end standards change when stores are refurbished.
How many weeks does it need to last? This determines the material weight and finish, not the budget.
Who will install it? Store staff, the manufacturer’s team or an external installer. Each option changes how the installation needs to be designed.
What percentage of replacement stock have I budgeted for? If the answer is zero, the campaign will have gaps.
Can the supplier replace material within the same time it takes to replenish the shelf? Remember: 2.7 days on average.
Frequently Asked Questions
What is the most effective type of POS display for a supermarket?
There is no universally most effective format. Effectiveness depends on the area of the store and the objective: gondola ends have the greatest impact on product turnover in negotiated promotions, shelf materials offer the best cost efficiency per point of sale, and floor-standing displays provide the greatest visibility for launches. In convenience stores, which already account for more than half of Spain’s store estate, shelf formats and gondola ends almost always outperform floor-standing displays simply because of space constraints.
How long does POS material last in a supermarket?
Between 2 weeks and 6 months depending on the format and location. A cardboard checkout display lasts 2–4 weeks; a floor-standing display in a traffic area, 3–4 weeks; and well-laminated section signage can last up to 6 months. The factor that shortens its lifespan most is not the material itself, but contact with trolleys and daily handling by store staff.
How many supermarkets are there in Spain?
There were 26,068 self-service stores, supermarkets and hypermarkets at the end of 2025, according to the 5th Proximity Food Retail Distribution Report in Spain prepared by Retail Data for ASEDAS. The network grew by almost 600 net locations compared with 2024, with 860 gross openings.
What percentage of replacement material should be allowed for in a POS campaign?
Between 8% and 12% of the base volume for campaigns lasting 4–8 weeks in retail chains with more than 500 points of sale. The percentage increases for floor-standing formats and high-footfall stores, and decreases for protected shelf materials.
Can the same POS design be used for every retail chain?
The artwork can; the dimensions and installation systems cannot. Every retail chain has its own gondola-end standards, internal rules governing hanging elements and different installation requirements. Producing material without checking the actual plans for each retailer is the most common reason why material never gets installed.
About the author
Sergio Triguero is Director of Strategic Marketing and Business Development at Artyplan, with more than 20 years of experience in B2B marketing, trade marketing and key account management in the graphic production sector.
Artyplan has produced and installed graphic materials since 1965, with production centres in Barcelona (+5,000 m²) and Madrid (+2,000 m²), for campaigns for brands including Nestlé, ALDI, Grupo Pascual and Estrella Damm.
Sources
- ASEDAS / Retail Data — V Informe de Distribución Alimentaria de Proximidad en España (2026, datos de 2025)
- AECOC / NIQ — OSA Barometer, on-shelf availability (first half of 2024)
- Shop! Association (formerly POPAI) — Shopper Engagement Study (2012, updated 2014)